Summary - Equatorial Weather Analysis:
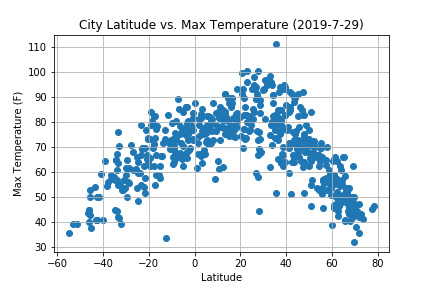
In a recent assignment, I was presented with the question, "What is the weather like as you get closer to the equator? And before you answer 'hotter', how would you prove it?"
So off I went. I built a series of plots to analyze Temperature, Humidity, Cloudiness, and Wind Speed at various latitudes across the Earth. Using 'numpy', I first generated a random set of 1500 Latitude/Longitude coordinate pairs. These coordinate pairs were passed through 'citipy' to find the nearest city to each pair. After removing duplicates, 594 random cities spread across the world remained.
With a sizable list of cities, I was ready to collect the weather data. I leveraged the OpenWeatherMap API and queried the service for the current weather in each of the 594 cities. Some of them could not be found by OpenWeatherMap and were subsequently discarded. The JSON received from the API was converted to a dataframe using 'pandas' and 4 plots were generated leveraging 'matplotlib'.
Feel free to browse around this project site to review my plots and observations.
I have also provided a link back to my personal profile page and to a listing of my other project
pages in the menu bar at the top of the page. If you have any questions or comments, please email me. I always enjoy hearing your feedback!
Michael S. Fox
foxms1010@gmail.com
Visualizations