Equatorial Weather Analysis - Cloudiness:
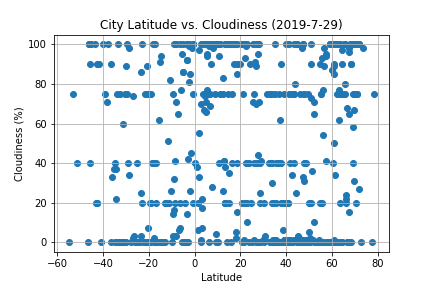
The highest concentration of 100% cloudiness appears to cluster between -10 deg lattitude and 20 deg lattitude with the equator falling inside that range. This indicates that the region between the Tropics is the cloudiest region of the planet.
Note: While there appears to be some stratification trend, this is merely a result of the method in which cloudiness is measured. As described on several metereological websites, cloudiness is based on visual observations and recorded in oktas. 1 okta represents a cloud amount of 1 eighth or less, but not zero. The chart shows the clustering of observations around the 1/8th breakpoints.
Visualizations