Equatorial Weather Analysis - Max Temperatures:
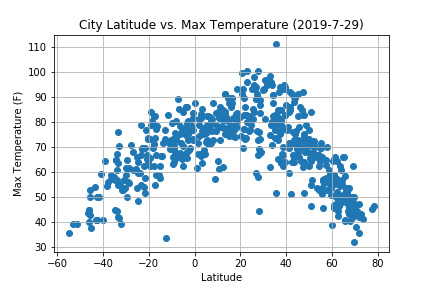
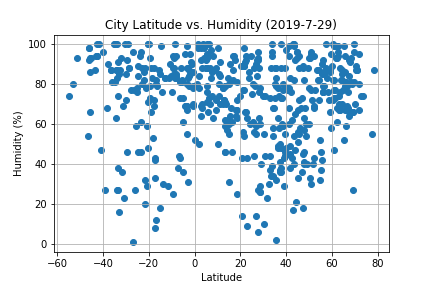
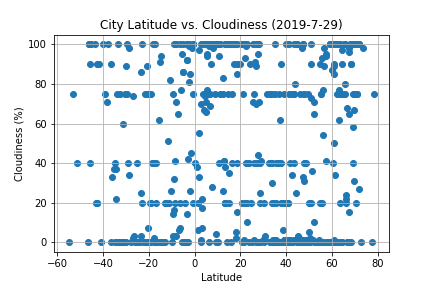
There is an arc-shaped distribution of max temperatures, however the peak of the arc is NOT at the equator as expected. Rather it is closer to 20 deg latitude (Tropic of Cancer). This latitudinal line cuts through one of the world's biggest deserts, the Sahara, which could explain the higher temperatures along this line. The Humidity Plot and Cloudiness Plot may also help explain the slightly lower temperatures at the equator as compared to the Tropic of Cancer. For example, a higher humidity (Observation 1) at the equator means more moisture in the air. This can lead to a higher cloud cover (Observation 2). And a higher cloud cover can help shield the earth from the sun's direct rays thus giving some relief from the max temperatures.
Visualizations